Proposals/SmartEvidence/SmartEvidence with a rubric: Difference between revisions
From Mahara Wiki
< Proposals | SmartEvidence
No edit summary |
|||
| Line 8: | Line 8: | ||
'''[https://mahara.org/interaction/forum/topic.php?id=8390 Corresponding discussion]''' | '''[https://mahara.org/interaction/forum/topic.php?id=8390 Corresponding discussion]''' | ||
The idea of using a rubric is further developed in the [[Developer_Area/Specifications_in_Development/SmartEvidence/SmartEvidence_with_rubrics,_artefact_and_page_alignment | concept of a SmartEvidence collection that supports the aligning of artefacts and pages]]. | |||
=Evidence map overview= | =Evidence map overview= | ||
Revision as of 14:51, 24 December 2019
Introduction
SmartEvidence in Mahara is the functionality that allows organisations to integrate competency frameworks and visualise these using evidence maps to gain a quick overview of the competencies that have been achieved and that still need to be worked on.
Currently, SmartEvidence allows for the use of competency frameworks that have a single level. Multi-level frameworks, i.e. those that use a rubric or include multiple levels against the same overall criteria, are not yet supported. This proposal outlines how frameworks that use a rubric can be created through an enhancement of SmartEvidence.
Example of a framework that could be covered: DCU Academic Development and Promotion Framework
The idea of using a rubric is further developed in the concept of a SmartEvidence collection that supports the aligning of artefacts and pages.
Evidence map overview
It will be possible to define different levels (up to 6 per default). These levels will each receive a unique icon. The shape of the icon is one dimension of encoding to differentiate the various levels from each other. In addition, when the mouse is hovered over the icon, text is displayed that indicates the level of achievement.
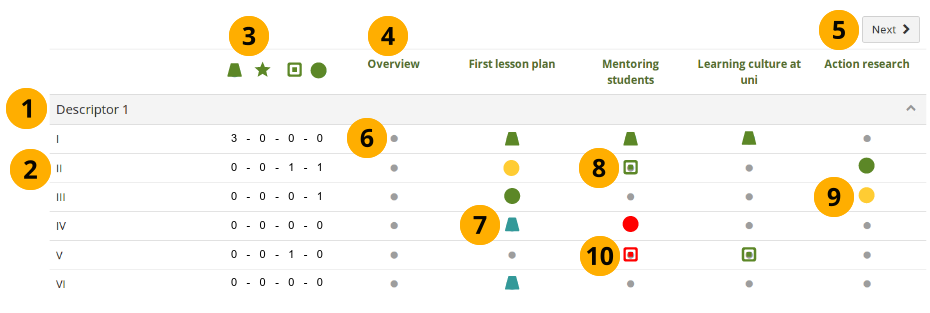
Below is the evidence map, and the callouts indicate different elements in it that are explained further. Displayed is the proposed solution that includes existing and new functionality.
- The category in which the individual standards / dimensions fall. That can be expanded or collapsed.
- The dimensions themselves. Numbers or also short phrases can be used.
- The icons for the individual levels of achievement in their order. The numbers below show how many dimensions have been achieved on each level. This summary is optional and can be left out of the display by the site administrator.
- The portfolio page titles are displayed and linked to the actual pages for easy reference.
- If the portfolio contains more than 5 pages, viewers of the portfolio can scroll to them.
- A little grey circle is displayed when the particular page has not been mapped to a dimension.
- The icon for the level of achievement that the portfolio author is attempting is displayed in blue when they have provided evidence and reflections so that a reviewer knows that they can look at the evidence.
- The icon for the level of achievement that the portfolio author is attempting is displayed in green when the reviewer approves of the portfolio author having achieved this level that they wanted to achieve.
- The icon for the level of achievement that the portfolio author is attempting is displayed in yellow when the reviewer does not yet fully agree that the portfolio author has achieved the desired level and requires more evidence from the portfolio owner.
- The icon for the level of achievement that the portfolio author is attempting is displayed in red when the reviewer disagrees that this level has been achieved. The portfolio author can remove the association between the portfolio page and the annotation and provide alternative evidence.
Evidence map display of dimensions
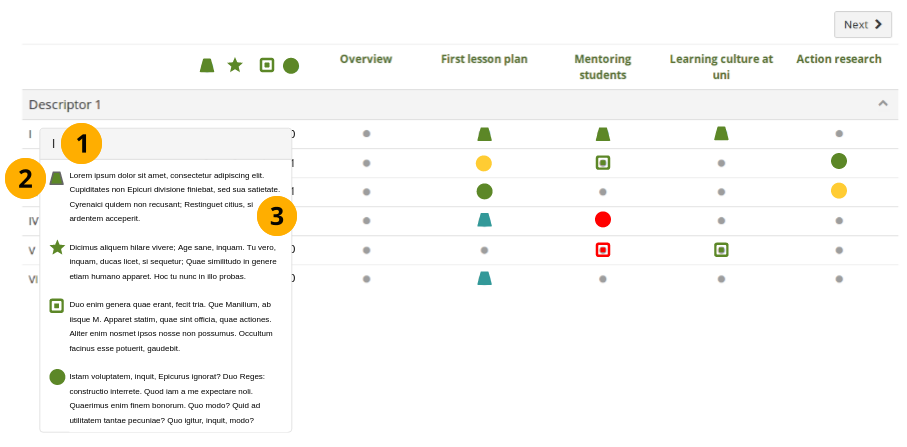
To avoid that academics and also reviewers need to consult an external document to remember what each level stands for, the dimension descriptors are included in the SmartEvidence map. They are displayed for each dimension when the respective title of the dimension is hovered over with the mouse or clicked on smart devices.
- In the resulting pop-up window, the full title of the dimension is displayed.
- Each level of achievement is displayed with its respective icon.
- The description for each level is shown. This can include lists, links, and other HTML mark-up.
Aligning a portfolio page with a dimension
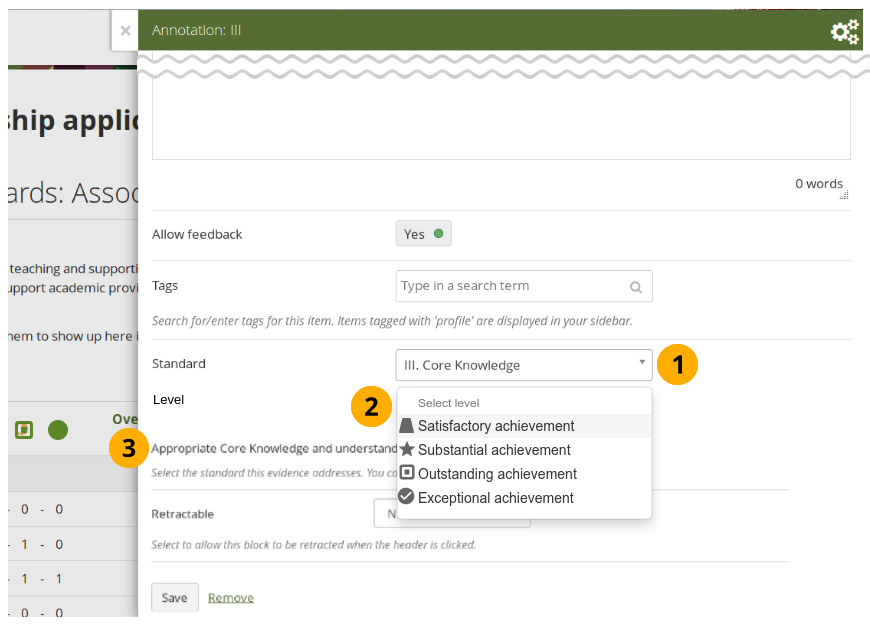
The portfolio author submitting the portfolio to the reviewer decides which level they are targeting for this particular review. When they align the portfolio page to a dimension with the help of the annotation, they write their meta reflection and can then select the level they are targeting.
- The dimension to which they are aligning this particular portfolio page is selected.
- Below that in another drop-down menu, the level titles are displayed including the respective icon,
- The description for the selected level is displayed to prevent that the page gets very long and the portfolio author can focus on the level in question.
- When the reviewer views the portfolio, they can leave comments and either approve or not approve of the assessment.
Overall view of the levels of achievement in a radar chart
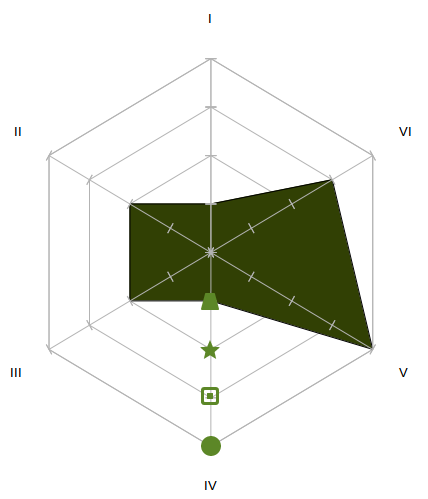
With the help of a radar chart, it will be possible to see where a portfolio author stands overall in their assessment across the entire portfolio. The levels of achievement are represented as the spider web and the dimensions are aligned as the spokes.
The chart.js library would be used. View an example of a radar plot.


