Developer Area/Php profiling
From Mahara Wiki
< Developer Area
What is profiling
Profiling is a method that is used to detect performace issues. For this we use tools to record stack traces of the running program to later be analysed
The install and configuration instructions work on Ubuntu 18.04
Xdebug
The first thing we need to do is installed Xdebug php extension to get the data of Mahara's php scripts. This extension can also be used for debugging php code well, but I will only add the instructions fro profiling here.
install extension
sudo apt-get install php-xdebug
Check the extension is there
php -m | grep xdebug
On php.ini you need to add the following lines
xdebug.remote_enable = 1
xdebug.remote_autostart = 1
zend_extension = /usr/lib/php/20170718/xdebug.so
you should check where is the xdebug.so in your machine
Add the setting for xdebug profiling
Here you can choose if you want to trace all the php code that is run or only a few scripts by passing an argument to the selected ones. more information on this here https://xdebug.org/docs/profiler
To trace all scripts
Set to 1 to turn it on for every request
xdebug.profiler_enable = 0
To trace only the scripts with the parameter
Let's use a GET/POST parameter to turn on the profiler
xdebug.profiler_enable_trigger = 0
The GET/POST value we will pass; empty for any value
xdebug.profiler_enable_trigger_value = ""
Set up the output file name and location
Output cachegrind files to /tmp so our system cleans them up later
xdebug.profiler_output_dir = "/tmp/profiling"
xdebug.profiler_output_name = "cachegrind.out.%p"
Don't forget to restart the server
sudo service apache2 restart
If you made it work, you'll get files named cachegrind.out.* in the directory /tmp/profiling. These will contain data that looks like this
fl=(158)
fn=(765)
1409 2 0
cfl=(1)
cfn=(564)
calls=1 0 0
1410 0 160
So we will need another application to display this information in human friendly way.
Kcachegrind
http://kcachegrind.sourceforge.net
Kcachegrind is a tool to display the profiling data in a graphical way. All those numbers and codes that we captured with the xdebug profiling tool can be seen as function calls and graphs.
How to in install
sudo apt-get install kcachegrind
Open the profiling files
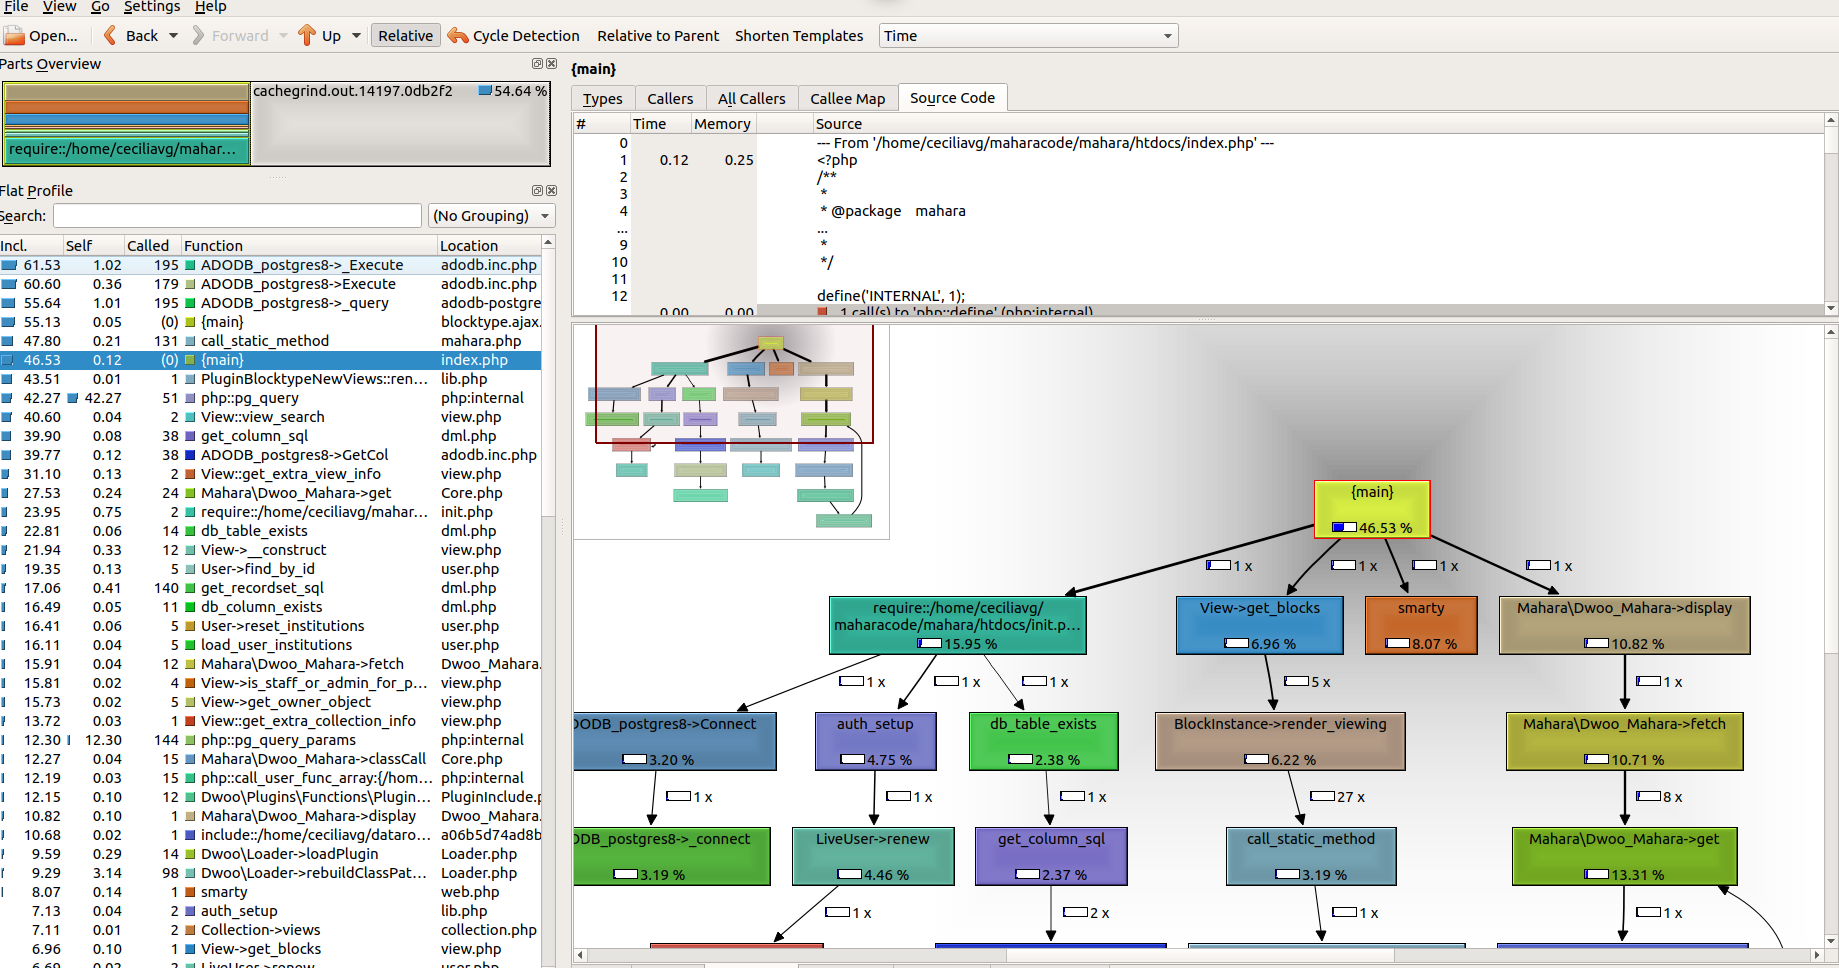
Once you have the kcachegrind installed, you should be able to open one of the xdebug data generated files. On the kcachegrind application, open one of the 'cachegrind.out' files located in the directory set on xdebug.profiler_output_dir property (php.ini). You should be seeing something like
How to use it to identify code to refactor
Here you can see all the function call and the resources consumed by it. In this case I've selected the resource to be 'Time' but you can change that to be 'Memory' at the top bar.
On the left table, the functions can be order by self, and incl. where
- self: cost of the function itself ('Self Cost')
- incl.: cost including all called functions ('Inclusive Cost')
You can play with this to identify which functions have the higher cost and should be looked into. Take into consideration that this method will not differentiate between Mahara code and third party library functions. There's not much we can do about the cost of the third party function calls but we can check how many times they are being called by our code.
On the right side we have the graph view, here we have the sequence of function calls and how many times they are executed. We should be paying attention to the call that have great cost (% of the total cost) and are repeated many times.
More information of how to use this application and what the settings mean can be found here
Common error
- I've set up the Xdebug tool for profiling but the 'cachegrind.out' are not generated.
Check the permissions. The browser should be able to access and to write.
